Home sales down in May while inventory continues to increase
The number of transactions on the Multiple Listing Service® (MLS®) declined in May compared to what is typical for this time of year in Metro Vancouver1. This shift has allowed the inventory of homes available for sale to continue to accumulate with over 13,000 homes now actively listed on the MLS® in the region.
Sales
The Greater Vancouver REALTORS® (GVR)2 reports that residential sales in the region totalled 2,733 in May 2024, a 19.9 per cent decrease from the 3,411 sales recorded in May 2023. Last month’s sales total was also down 19.6 per cent from the 10-year seasonal average for May (3,398).
"The surprise in the May data is that sales have come in softer than what we’d typically expect to see at this point in the year, while the number of newly listed homes for sale is carrying some of the momentum seen in the April data," said Andrew Lis, REBGV director of economics and data analytics.
“It’s a natural inclination to chalk these trends up to one factor or another, but what we’re seeing is a culmination of factors influencing buyer and seller decisions in the market right now. It’s everything from higher borrowing costs, to worries about the economy, to policy interventions imposed by various levels of government.”
Listings
There were 6,374 detached, attached and apartment properties newly listed for sale on the MLS® in Metro Vancouver in May 2024. This represents a 12.6 per cent increase compared to the 5,661 properties listed in May 2023 and a seven per cent increase compared to the 10-year seasonal average (5,958).
The total number of properties currently listed for sale on the MLS® system in Metro Vancouver is 13,600, a 46.3 per cent increase compared to May 2023 (9,293). This total is also up 19.9 per cent above the 10-year seasonal average (11,344).
Sales-to-active listings ratio
Across all detached, attached and apartment property types, the sales-to-active listings ratio for May 2024 is 20.8 per cent. By property type, the ratio is 16.8 per cent for detached homes, 25.1 per cent for attached, and 22.5 per cent for apartment properties.
Analysis of the historical data suggests downward pressure on home prices occurs when the ratio dips below 12 per cent for a sustained period, while home prices often experience upward pressure when it surpasses 20 per cent over several months.
“With market trends now tilting back toward more balanced conditions, as the number of new listings outpaces the number of sales, we should expect to see slower price growth over the coming months,” Lis said.
“Up until recently, prices were climbing modestly across all market segments. But with rising inventory levels and softening demand, buyers who’ve been waiting for an opportunity might have more luck this summer, even if borrowing costs remain elevated.”
By property type
The MLS® Home Price Index (HPI) composite benchmark price3 for all residential properties in Metro Vancouver is currently $1,212,000. This represents a 2.3 per cent increase over May 2023 and a 0.5 per cent increase compared to April 2024.
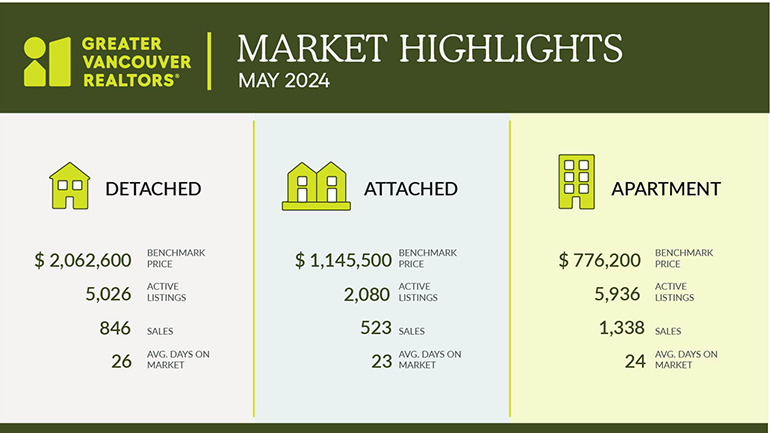
Sales of detached homes in May 2024 reached 846, an 18.9 per cent decrease from the 1,043 detached sales recorded in May 2023. The benchmark price for a detached home is $2,062,600. This represents a 5.9 per cent increase from May 2023 and a 1.3 per cent increase compared to April 2024.
Sales of apartment homes reached 1,338 in May 2024, a 22.7 per cent decrease compared to the 1,730 sales in May 2023. The benchmark price of an apartment home is $776,200. This represents a 2.2 per cent increase from May 2023 and a 0.3 per cent decrease compared to April 2024.
Attached home sales in May 2024 totalled 523, a 14 per cent decrease compared to the 608 sales in May 2023. The benchmark price of a townhouse is $1,145,500. This represents a 5.2 per cent increase from May 2023 and a 0.9 per cent increase compared to April 2024.
Download the May 2024 stats package
1 Areas covered by Greater Vancouver REALTORS® include: Bowen Island, Burnaby, Coquitlam, Maple Ridge, New Westminster, North Vancouver, Pitt Meadows, Port Coquitlam, Port Moody, Richmond, South Delta, Squamish, Sunshine Coast, Vancouver, West Vancouver, and Whistler.
2 On February 12, 2024, The Real Estate Board of Greater Vancouver changed its organizational name to the Greater Vancouver REALTORS®.
3 The national MLS® Home Price Index (MLS® HPI) operations group underwent an annual review of the model in May in-line with statistical best practices. The attributes and neighbourhoods within the model were updated based on sales data to more accurately reflect current market conditions. To ensure the MLS® HPI coverage is consistent and comparable, historical aggregate and composite data has been recalculated.