Summer sees home listing supply decline in Metro Vancouver

While home buyers have remained active in Metro Vancouver* throughout the summer, the supply of homes for sale has declined steadily since June.
The Real Estate Board of Greater Vancouver (REBGV) reports that residential home sales in the region totalled 3,152 in August 2021, a 3.4 per cent increase from the 3,047 sales recorded in August 2020, and a 5.2 per cent decrease from the 3,326 homes sold in July 2021.
Last month’s sales were 20.4 per cent above the 10-year August sales average.
“August was busier than expected, and listings activity isn’t keeping up with the pace of demand. This is leaving the market under supplied.” said Keith Stewart, REBGV economist.
Metro Vancouver listings
There were 4,032 detached, attached and apartment properties newly listed for sale on the Multiple Listing Service® (MLS®) in Metro Vancouver in August 2021. This represents a 30.6 per cent decrease compared to the 5,813 homes listed in August 2020 and a 7.9 per cent decrease compared to July 2021 when 4,377 homes were listed.
The total number of homes currently listed for sale on the MLS® system in Metro Vancouver is 9,005, a 29.7 per cent decrease compared to August 2020 (12,803) and an 8.6 per cent decrease compared to July 2021 (9,850).
“Housing supply is the biggest factor impacting the market right now. To help relieve pressure on prices and improve peoples’ home buying options, the market needs a more abundant supply of homes for sale.” Stewart said. “Housing affordability has been a key issue in the federal election. We encourage the political parties to focus on policy solutions that will help streamline the creation of more diverse housing options for hopeful home buyers today and into the future.”
Sales-to-active-listings ratio
For all property types, the sales-to-active listings ratio for August 2021 is 35 per cent. By property type, the ratio is 25.3 per cent for detached homes, 51.8 per cent for townhomes, and 39.2 per cent for apartments.
Generally, analysts say downward pressure on home prices occurs when the ratio dips below 12 per cent for a sustained period, while home prices often experience upward pressure when it surpasses 20 per cent over several months.
“When assessing the market, it’s important to understand that while year-over-year price increases have reached double digits, most of the increases happened three or more months ago,” Stewart said. “To better understand the latest home price trends in your preferred location and home type, talk with your local REALTOR®.”
Metro Vancouver home prices
The MLS® Home Price Index composite benchmark price for all residential properties in Metro Vancouver is currently $1,176,600. This represents a 13.2 per cent increase over August 2020 and a 0.1 per cent increase compared to July 2021.
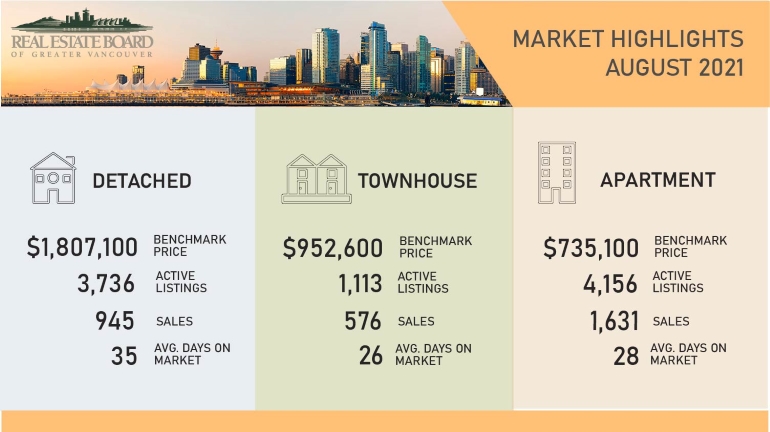
Sales of detached homes in August 2021 reached 945, a 13.7 per cent decrease from the 1,095 detached sales recorded in August 2020. The benchmark price for a detached home is $1,807,100. This represents a 20.4 per cent increase from August 2020 and a 0.3 per cent increase compared to July 2021.
Sales of apartment homes reached 1,631 in August 2021, a 22.4 per cent increase compared to the 1,332 sales in August 2020. The benchmark price of an apartment property is $735,100. This represents a 7.6 per cent increase from August 2020 and a 0.2 per cent decrease compared to July 2021.
Attached home sales in August 2021 totalled 576, a 7.1 per cent decrease compared to the 620 sales in August 2020. The benchmark price of an attached home is $952,600. This represents a 16.5 per cent increase from August 2020 and a 0.3 per cent increase compared to July 2021.
Download the August 2021 stats package
Note: Areas covered by the Real Estate Board of Greater Vancouver include: Burnaby, Coquitlam, Maple Ridge, New Westminster, North Vancouver, Pitt Meadows, Port Coquitlam, Port Moody, Richmond, South Delta, Squamish, Sunshine Coast, Vancouver, West Vancouver, and Whistler.
 The Largest Number of Homes for Sale